USD/MXN Technical Analysis: Short-term broadening wedge, risks titled to the downside
- The Mexican peso outperformed today after financial markets have positively received the 2019 budget.
- The USD/MXN is moving in a broadening wedge in the short-term, at the moment with a bearish bias that could point to a test of the lower limit. A consolidation significantly below 19.95 would open the doors to an extension of the bearish correction, targeting 19.60/70.
- To the upside, resistance levels are seen at 20.40 and then 20.70. A close above the last one would expose 2018 highs at 20.95/21.00.
USD/MXN 4-hour chart
-636806752959614998.png)
USD/MXN Weekly chart
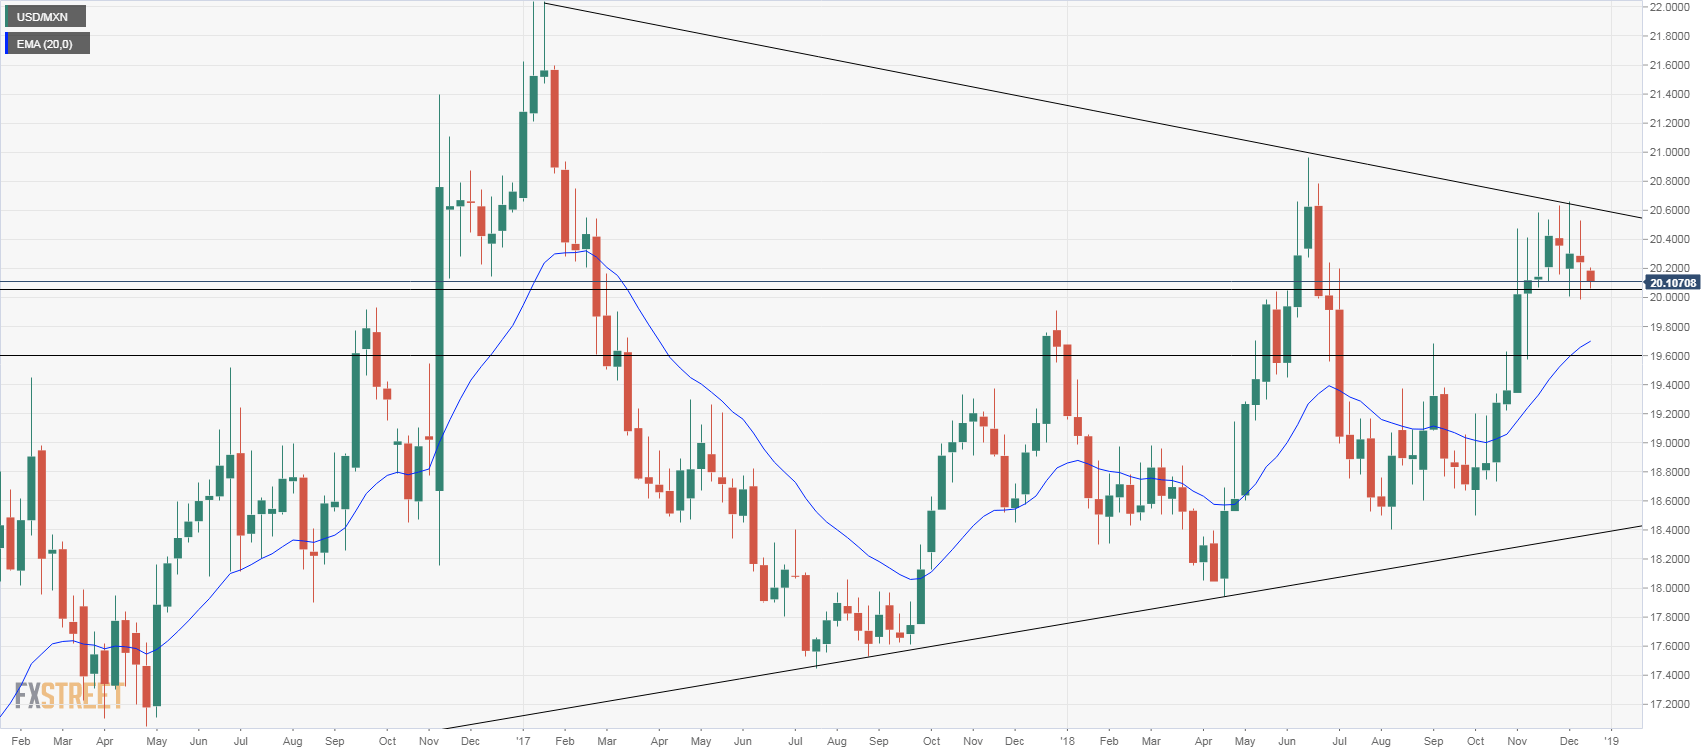
USD/MXN
Overview:
Today Last Price: 20.1106
Today Daily change %: -0.651%
Today Daily Open: 20.2423
Trends:
Previous Daily SMA20: 20.3407
Previous Daily SMA50: 19.9191
Previous Daily SMA100: 19.4117
Previous Daily SMA200: 19.3054
Levels:
Previous Daily High: 20.5312
Previous Daily Low: 20.1981
Previous Weekly High: 20.5312
Previous Weekly Low: 19.9874
Previous Monthly High: 20.6355
Previous Monthly Low: 19.576
Previous Daily Fibonacci 38.2%: 20.3254
Previous Daily Fibonacci 61.8%: 20.404
Previous Daily Pivot Point S1: 20.1165
Previous Daily Pivot Point S2: 19.9907
Previous Daily Pivot Point S3: 19.7834
Previous Daily Pivot Point R1: 20.4497
Previous Daily Pivot Point R2: 20.657
Previous Daily Pivot Point R3: 20.7828