Gold Technical Analysis: Yellow Metal drops to 3-day lows
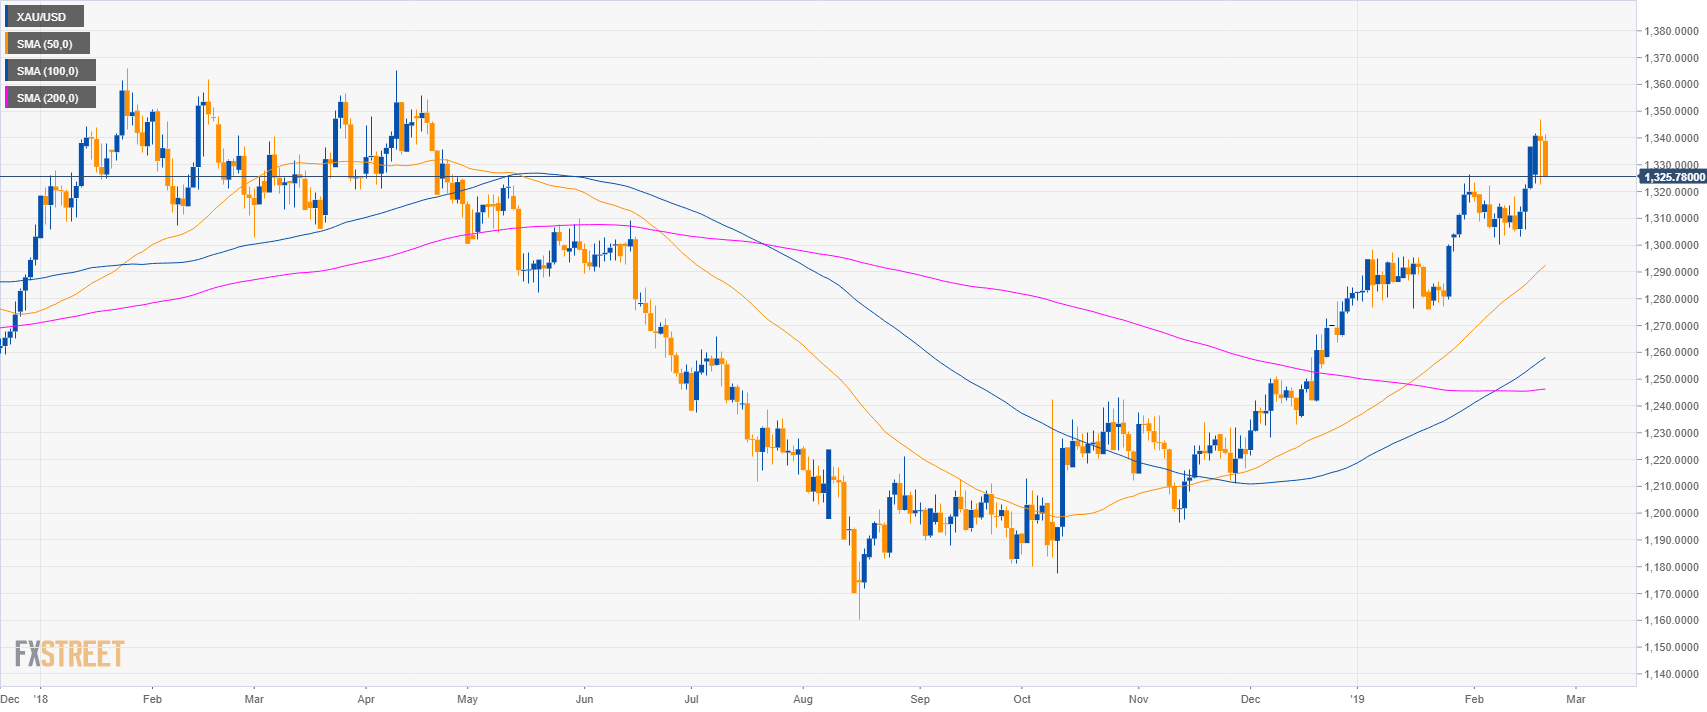
Gold daily chart
- Gold is in a bull trend above its main simple moving averages (SMAs).
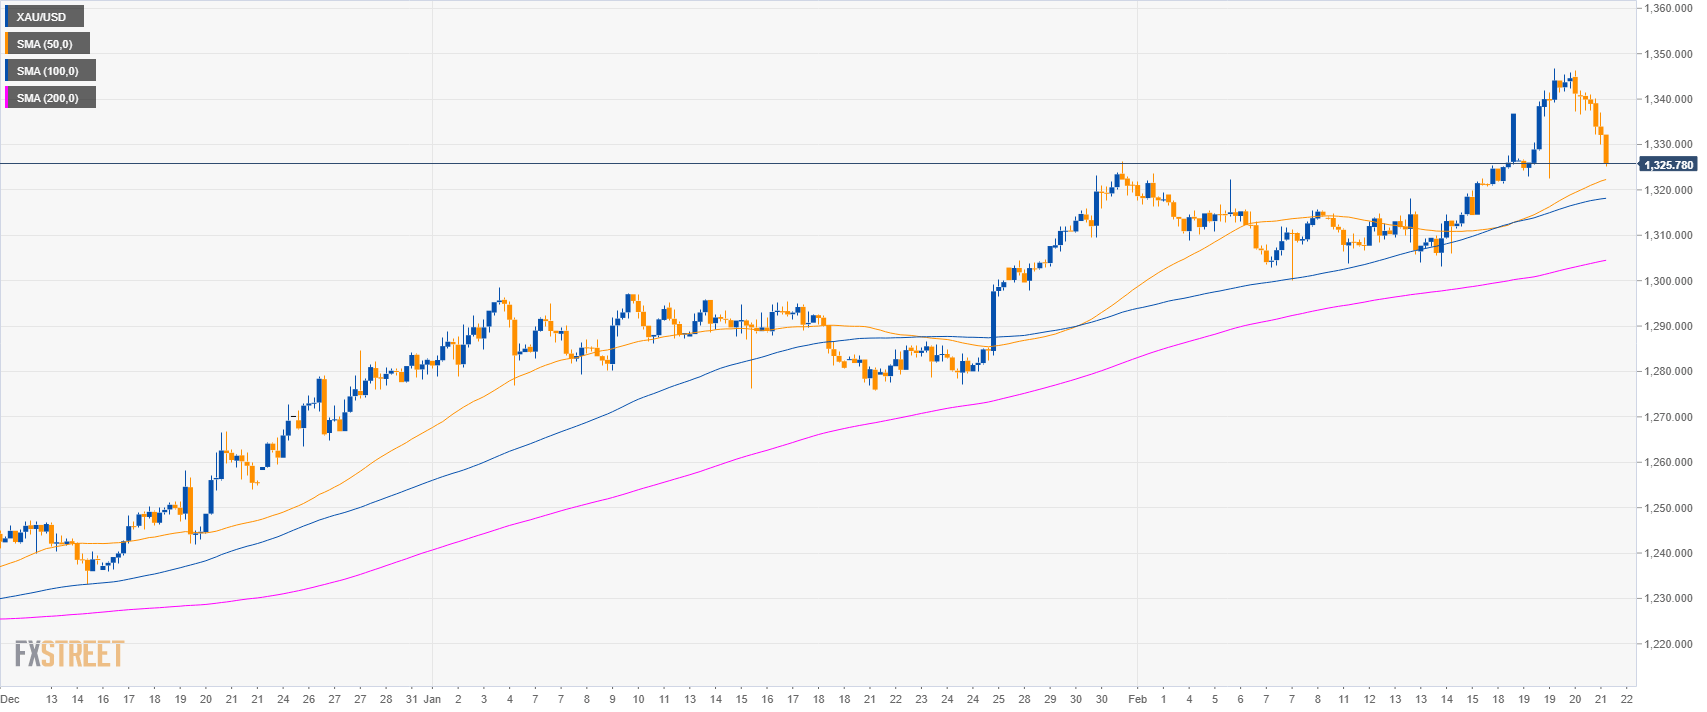
Gold 4-hour chart
- Gold is trading above its main SMAs suggesting bullish momentum in the medium-term.
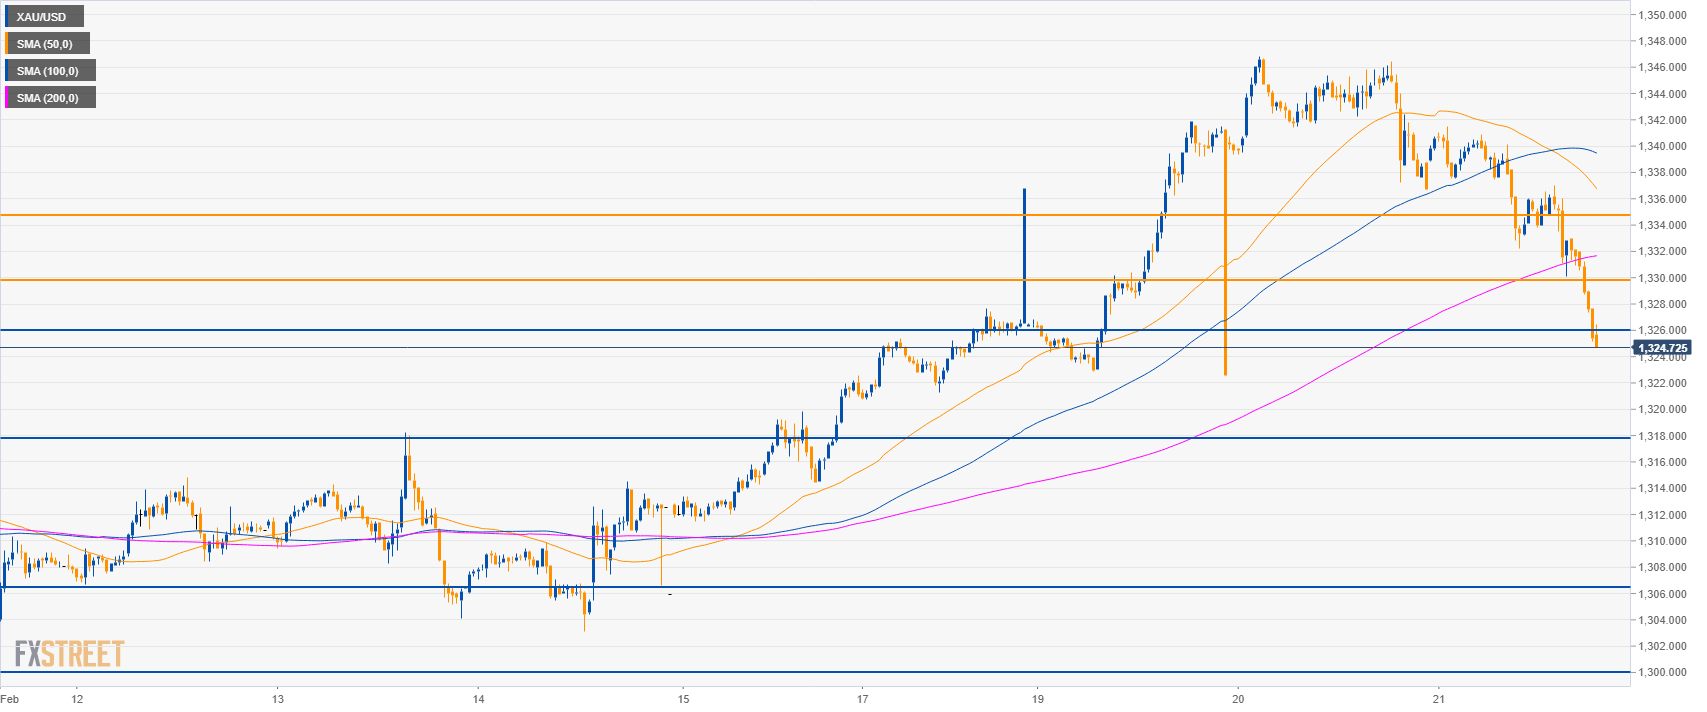
Gold 30-minute chart
- Gold broke below its main SMAs suggesting a bearish bias in the short-term.
- A bearish break below 1,1326.00 can lead to 1,1318.00 level.
- To the upside, resistance is at 1,330.00 and 1,335.00 level.
Additional key levels:
XAU/USD
Overview:
Today Last Price: 1325.8
Today Daily change: -13.10 points
Today Daily change %: -0.98%
Today Daily Open: 1338.9
Trends:
Daily SMA20: 1314.31
Daily SMA50: 1290.86
Daily SMA100: 1258.24
Daily SMA200: 1233.81
Levels:
Previous Daily High: 1346.85
Previous Daily Low: 1322.6
Previous Weekly High: 1322.55
Previous Weekly Low: 1303.15
Previous Monthly High: 1326.25
Previous Monthly Low: 1275.9
Daily Fibonacci 38.2%: 1331.86
Daily Fibonacci 61.8%: 1337.59
Daily Pivot Point S1: 1325.38
Daily Pivot Point S2: 1311.87
Daily Pivot Point S3: 1301.13
Daily Pivot Point R1: 1349.63
Daily Pivot Point R2: 1360.37
Daily Pivot Point R3: 1373.88