Back


30 Aug 2019
GBP/USD technical analysis: Cable flirting with weekly lows amid USD strength, sub-1.2180 level
- After challenging the 1.2214 resistance, the Cable is hovering near weekly lows.
- The levels to beat for sellers are seen at 1.2156, followed by 1.2125 support levels.
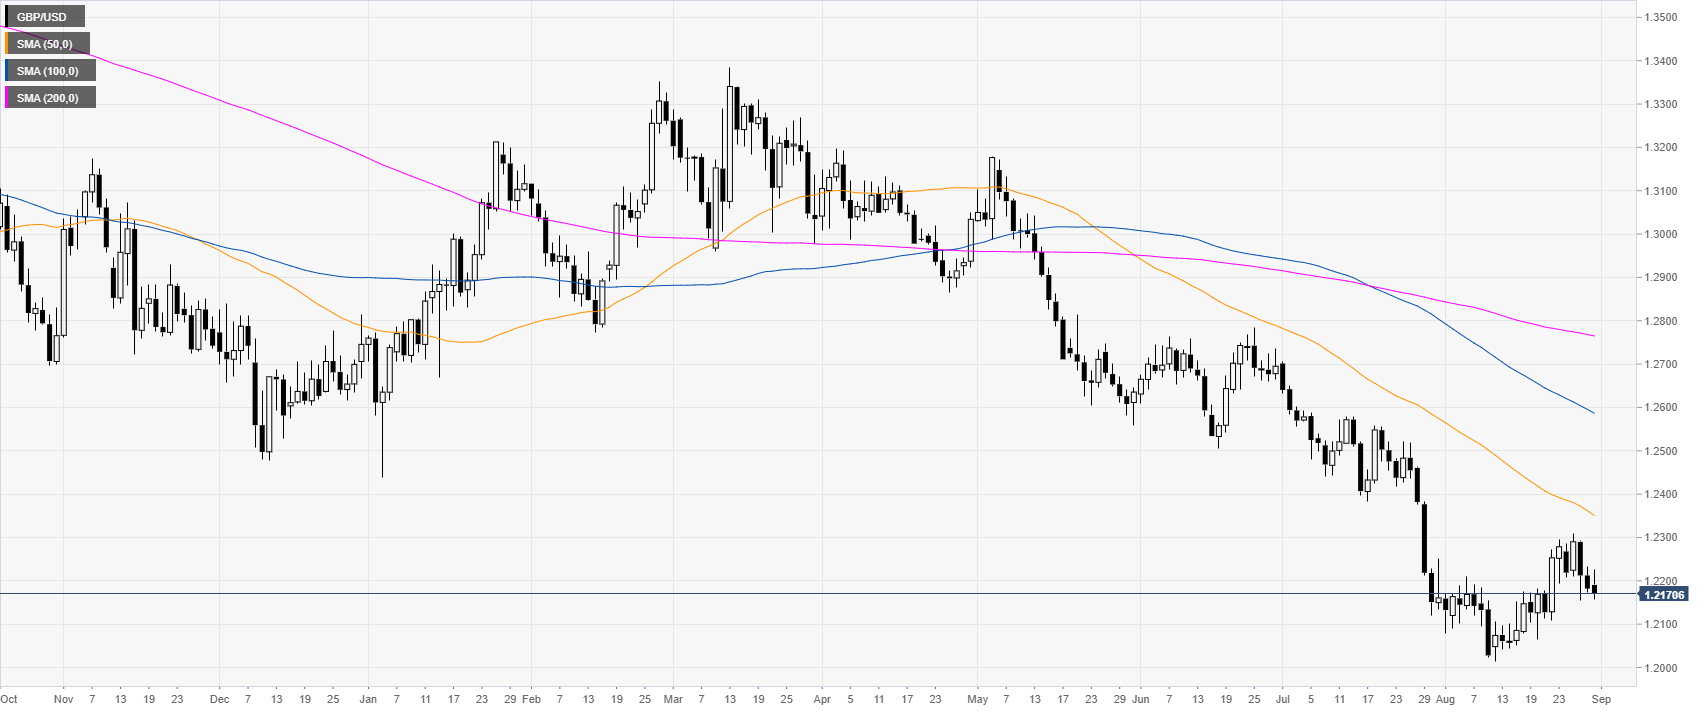
GBP/USD daily chart
The Sterling is trading in a bear trend below the main daily simple moving averages (SMAs). The market is on the defensive for the third day in a row as GBP/USD is trading below the 1.2300 figure.

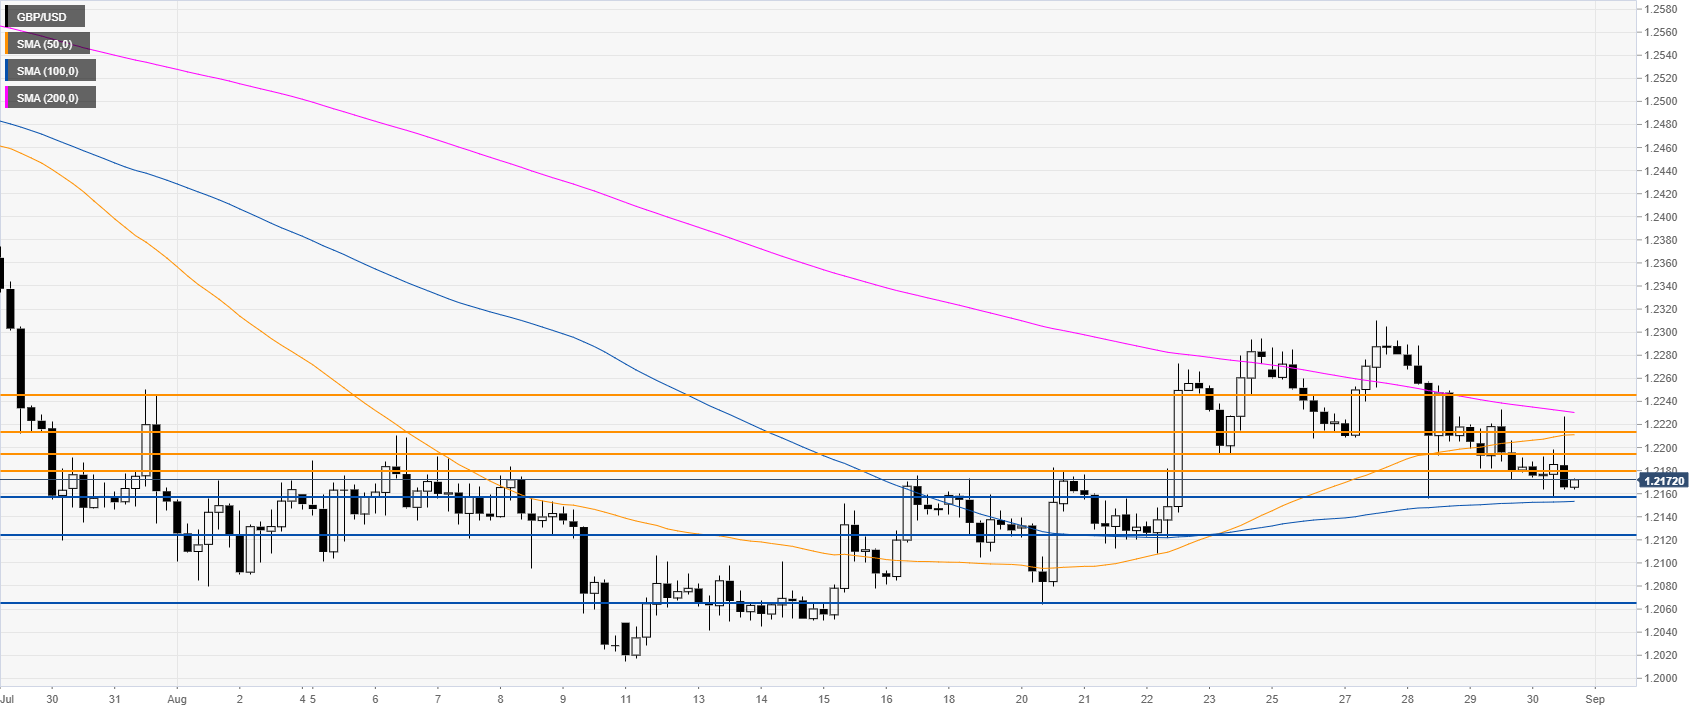
GBP/USD 4-hour chart
The Cable is trading below 1.2180 resistance and the 50/200 SMAs on the 4-hour time frame. GBP/USD bears are most likely looking for a break below the 1.2156 support and1.2125 level to potentially reach the 1.2065 level on the way down, according to the Technical Confluences Indicator.

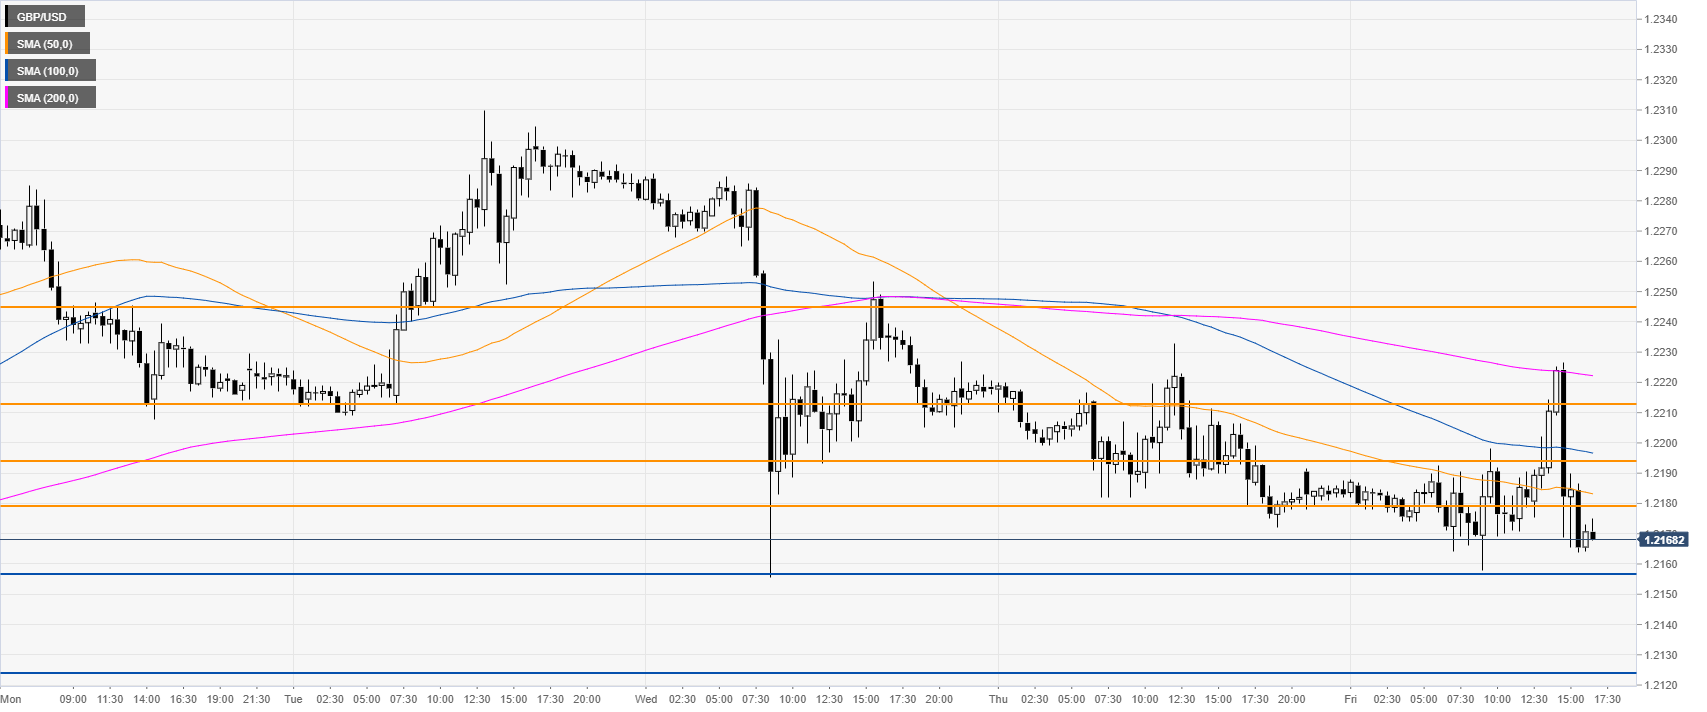
GBP/USD 30-minute chart
GBP/USD is trading below the main SMAs, suggesting a bearish bias in the near term. Immediate resistances are seen at the 1.2180, 1.2194, 1.2214 and 1.2245 levels, according to the Technical Confluences Indicator.

Additional key levels
