USD/IDR technical analysis: Sellers lurk around 14,120/30
- USD/IDR extends the latest recovery to the weekly high.
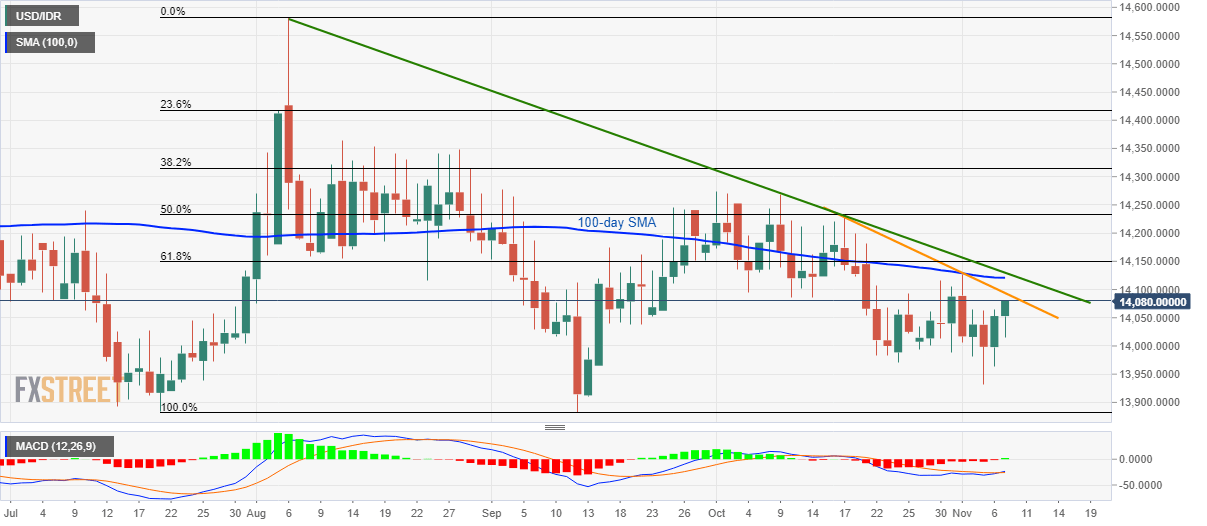
- The three-week-old falling trend line can question sellers immediately while 100-day SMA and multi-month long resistance line will tame bears afterward.
- Lows marked in July and September offers key support-zone.
The USD/IDR pair’s recent pullback is less likely to last for long as the key upside barriers stand tall to challenge buyers while the quote seesaws around 14,080 during Thursday’s Asian session.
Giving respect to the bullish signal of 12-bar Moving Average Convergence and Divergence (MACD), prices may rise further towards three-week-old descending trend line, at 14,095, a break of which will escalate run-up towards 14,120/30 resistance area including 100-day Simple Moving Average (SMA) and a falling resistance line since early-August.
If at all bulls manage to conquer 14,130 on a daily closing basis, 50% Fibonacci retracement of August-September declines, around 14,230, could please them ahead of pushing towards 14,275/80 region comprising multiple highs marked since early September.
Meanwhile, 14,000 round-figure could appear as the immediate support ahead of reigniting importance of the 13,880 level that envelopes lows marked in July and September month.
USD/IDR daily chart
Trend: pullback expected