Back
15 May 2020
USD/CAD Price Analysis: 200-HMA probes rising wedge confirmation above 1.4000
- USD/CAD bounces off 200-HMA despite confirming a bearish chart pattern the previous day.
- Buyers can aim for the weekly top on defying the breakdown.
- Sellers keep 61.8% Fibonacci retracement, Monday’s low on the cards.
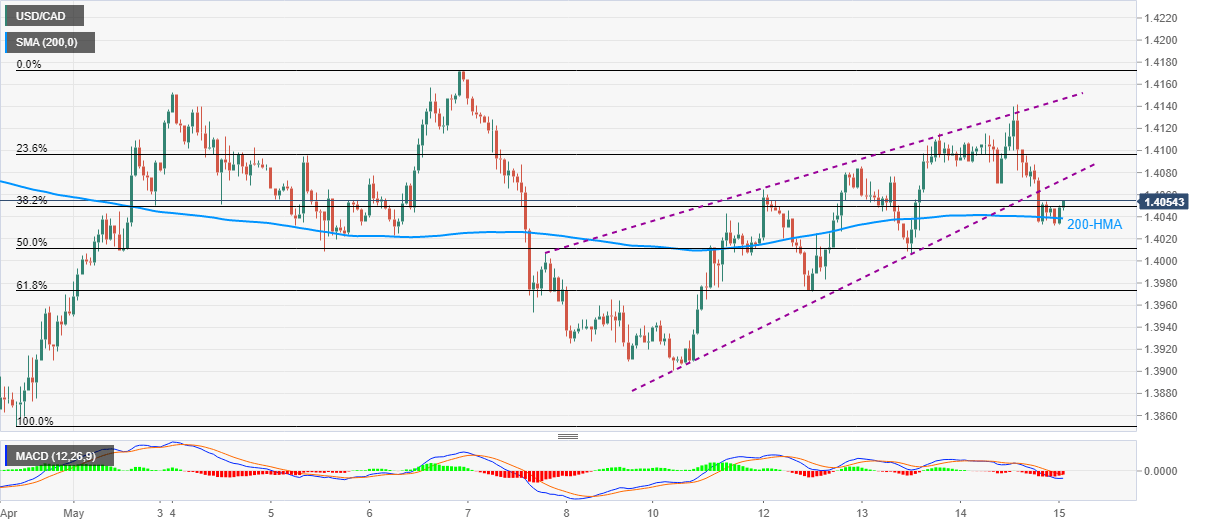
USD/CAD takes rounds to 1.4050 during the early Friday’s trading session. The Loonie pair confirmed a bearish chart formation on Thursday but bounced off 200-HMA recently.
Hence, buyers will look for a sustained break above the support-turned-resistance line, currently near 1.4075, for fresh entries.
In doing so, the weekly top near 1.4140 and the monthly high of 1.4173 could be on their radars.
Meanwhile, a sustained downside below the 200-HMA level of 1.4035 could drag the quote to 61.8% Fibonacci retracement of April 30 to May 06 upside, at 1.3973.
During the pair’s extended fall under 1.3973, Monday’s low near 1.3900 could lure the bears.
USD/CAD hourly chart
Trend: Pullback expected