WTI Price Analysis: Bulls pierce $60.00 to refresh yearly top, 2020 peak in focus
- WTI stays bid near the highest since January 2020.
- Sustained break of two-month-old resistance line directs bulls to 13-month top.
- 10-day, 21-day SMA add to the downside supports.
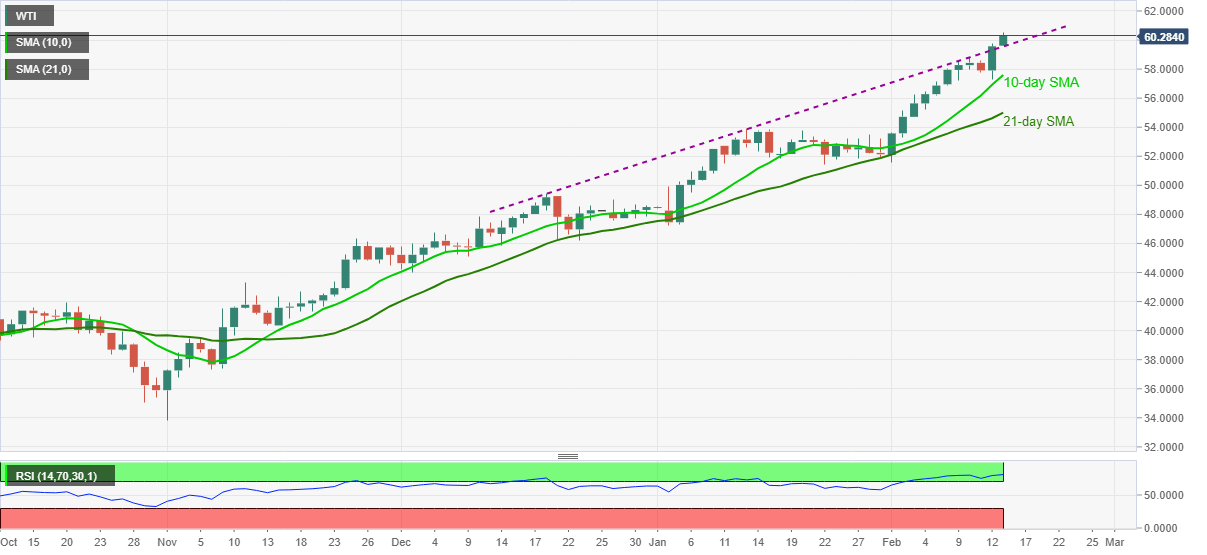
WTI remains firm above $60.00, currently up 1.23% to $60.30, during Monday’s Asian session. In doing so, the oil benchmark trades positively near the fresh high in 13 months, following the intraday high of $60.55.
Although overbought RSI conditions challenge the oil bulls, a successful break of an ascending trend line from December 18, currently around $59.54, keeps the buyers hopeful.
As a result, the previous year’s high of $65.45 is well in the spotlight while the September 2019 peak surrounding $63.15 and December 2019 high of $62.25 also gain the market’s attention.
It should, however, be noted that a downside break of $59.54 will need to break below the 10-day SMA level of $57.60 to recall the short-term WTI sellers.
Following that, 21-day SMA, at $55.00 now, holds the key to the quote’s further weakness towards the January high of $53.92.
WTI daily chart
Trend: Bullish