EUR/GBP Price Analysis: Jumps to the top end of a four-day-old trading range
- EUR/GBP gained some traction on Friday and climbed to a four-day-old trading range hurdle.
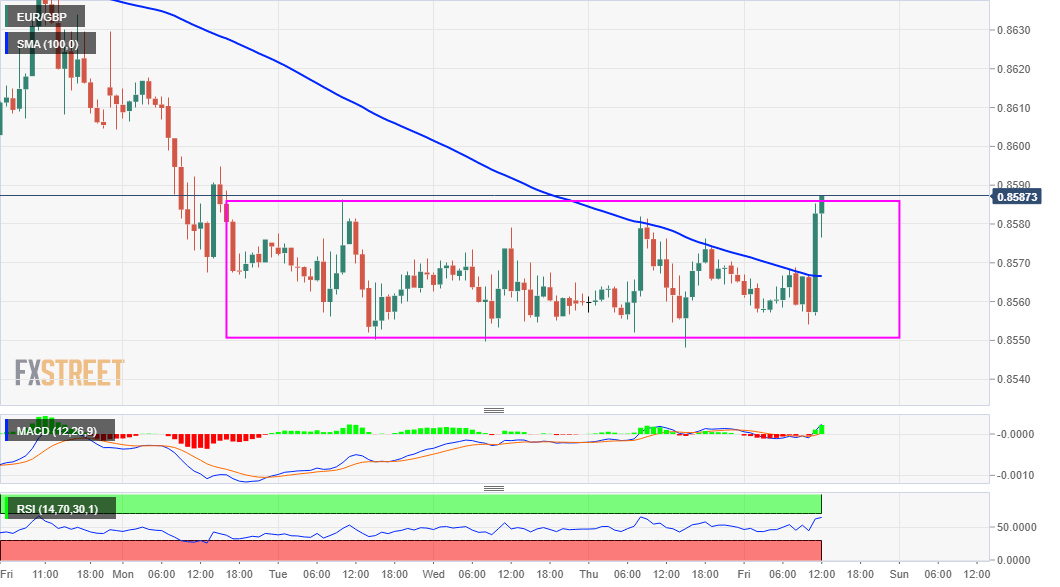
- The price action constitutes the formation of a bearish continuation rectangle chart pattern.
- Bullish technical indicators on hourly charts support prospects for some near-term recovery.
The EUR/GBP cross rallied around 30 pips in the last hour and jumped to test the top end of a four-day-old trading range, around the 0.8585-90 region.
The British pound was being weighed down by Friday's mostly softer UK macro data – monthly GDP print and Manufacturing/Industrial Production figures. On the other hand, the shared currency got a minor lift following the release of stronger-than-expected Eurozone Industrial Production data.
From a technical perspective, the range-bound price action constitutes the formation of a rectangle on hourly charts. Given the recent depreciating move witnessed over the past three months or so, the rectangle marks a brief pause and might still be categorized as a bearish continuation pattern.
That said, a sustained move beyond 100-period SMA on the 4-hourly chart was seen as a key trigger for intraday bullish traders. Moreover, oscillators on the mentioned chart have been gaining some positive traction and support prospects for an eventual breakout through the weekly trading range.
That said, technical indicators on the daily chart have just recovered from the oversold territory and are still holding deep in the bearish territory. Hence, any meaningful recovery attempt beyond the 0.8600 mark might still be seen as a selling opportunity and runs the risk of fizzling out quickly.
The next relevant resistance to the upside is pegged near the 0.8645 horizontal level ahead of the 0.8670-75 supply zone. A sustained move beyond has the potential to push the EUR/GBP cross further beyond the 0.8700 mark, towards testing a strong support breakpoint around the 0.8740 region.
On the flip side, the lower boundary of the trading range, around the 0.8550-40 region now seems to have emerged as immediate strong support. Bearish traders are likely to wait for some follow-through weakness below the said support before positioning for any further near-term downfall.
EUR/GBP 1-hourly chart
Technical levels to watch