Gold Price Analysis: XAU/USD path of least resistance is down after losing $1,800– Confluence Detector
- XAU/USD has slipped below $1,800 as market excitement has faded.
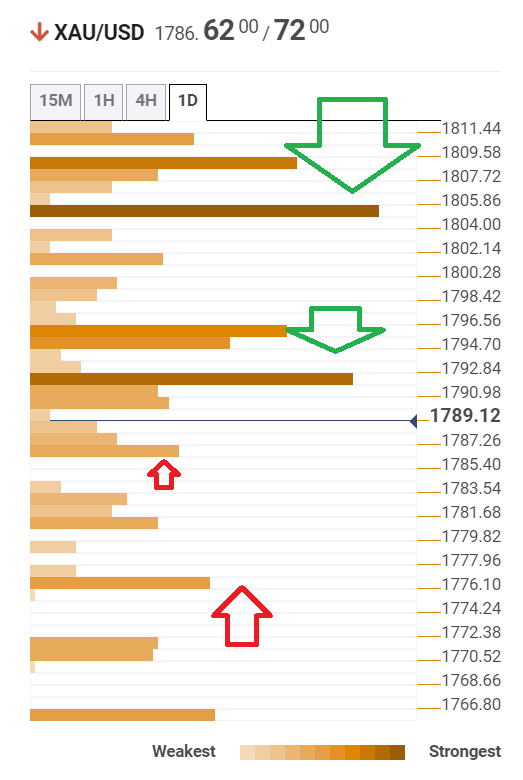
- The Confluence Detector is showing resistance lines are stronger than support lines.
- Gold Price Forecast: Bullish flag breakout in play for XAU/USD
Is that all folks? Gold has dropped below the psychologically significant $1,800 level after floating above it for only a handful of sessions. XAU/USD has been edging lower alongside the drop in market enthusiasm. Investors cheered signs that the Federal Reserve would refrain from tapering its bond-buying scheme. However, after several days of stock gains, some decided to take profits and XAU/USD lost its momentum.
Moreover, as tension mounts toward Fed Chair Jerome Powell's Jackson Hole speech, signs that the Delta covid variant is peaking have cause investors to rethink the intention to taper. If things are improving, perhaps the Fed could print fewer dollars. That would be an adverse development for the pre
How is it positioned on the charts?
The Technical Confluences Detector is showing that Gold faces a strong resistance line at $1,791, which is a cluster of lines including the 50-day Simple Moving Average and the Fibonacci 61.8%.
Further above, the next cap is at $1,805, which is where the Bollinger Band 1h-Upper and the Fibonacci 38.2% one-day converge.
Looking down, support is substantially weaker. The initial cushion is at $1,786, which is the confluence of the previous 1h-low and the Fibonacci 38.2% one week.
A more considerable cushion is $1,776, which is a juncture of lines including the Pivot Point one-month Support 1 and the BB 4h-Lower.
XAU/USD resistance and support levels
Confluence Detector
The Confluence Detector finds exciting opportunities using Technical Confluences. The TC is a tool to locate and point out those price levels where there is a congestion of indicators, moving averages, Fibonacci levels, Pivot Points, etc. Knowing where these congestion points are located is very useful for the trader, and can be used as a basis for different strategies.
Learn more about Technical Confluence