EUR/USD Price Analysis: Friday’s spinning top, oversold RSI test sellers, 1.1185 in focus
- EUR/USD seesaws around the lowest levels since June 2020.
- Friday’s candlestick, oversold RSI conditions test bears at multi-day low.
- Rebound remains elusive below 2021 bottom, 61.8% Fibonacci retracement of 2017-18 upside.
EUR/USD remains sidelined around 1.1145, keeping Friday’s corrective pullback from multi-day low amid a quiet start to the week’s trading.
In doing so, the major currency pair justifies Friday’s bullish spinning top candlestick amid oversold RSI conditions.
However, the last year’s low marked in December 2021 joins 61.8% Fibonacci retracement (Fibo.) of the pair’s 2017-18 advances to highlight 1.1185 as the key upside hurdle.
EUR/USD: Weekly chart
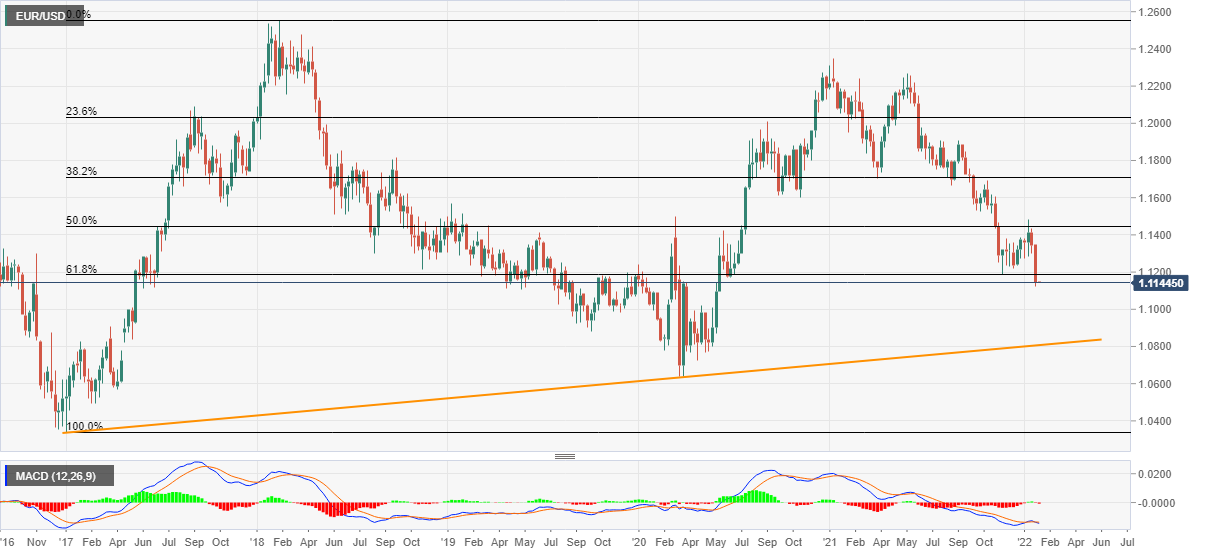
Trend: Bearish
If the pair manages to cross the 1.1185 resistance confluence, the corrective pullback could eye the 50-DMA level near 1.1300.
During the quote’s upside past 1.1300, the previous support line from November 24, 2021, near 1.1320 will act as an extra filter to the north before highlighting the December 2021 peak of 1.1386 for the EUR/USD bulls.
Alternatively, a downward sloping trend line from March 2021, near 1.1030, will lure the EUR/USD bears on breaking the recent multi-day bottom around 1.1120.
EUR/USD: Daily chart
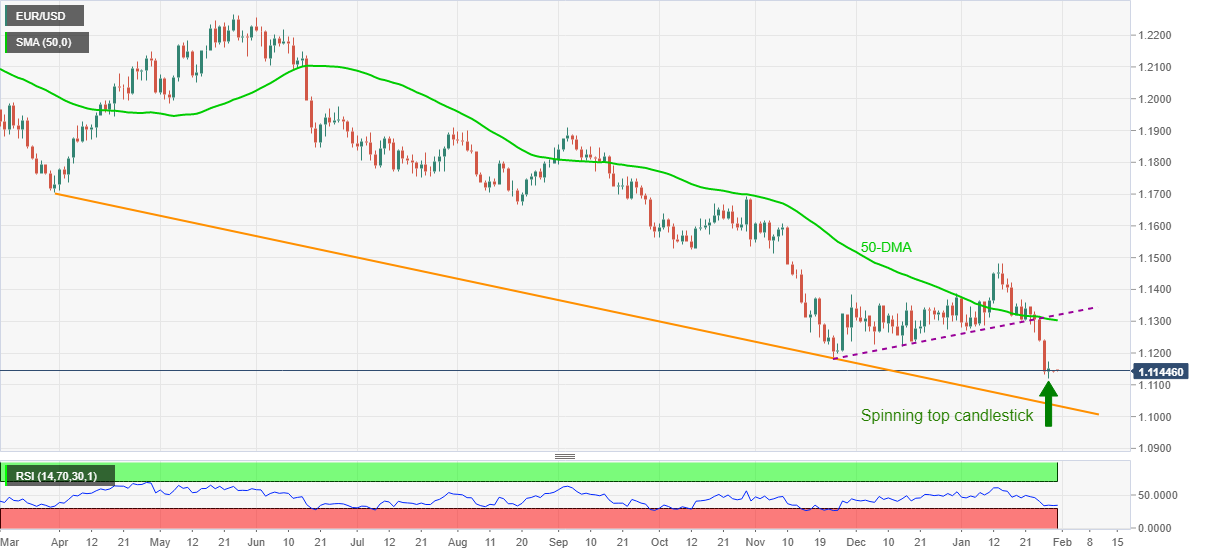
Trend: Bearish